Case studies
In our region, a wide range of applications have been developed using the products from the Hub, and these continue to grow.
Case study 1: A new approach to estimating pasture biomass
Cibo Labs, Queensland
Challenge: Cibo Labs is a Queensland-based agricultural data analytics company that services farms all over Australia. The company wanted to find a way to quantify pasture productivity, land condition and pasture biomass (produce on offer) for the livestock industry.
Solution: Cibo Labs combined pre-processed Sentinel-2 Surface Reflectance data, accessed via the Hub, with on-ground data and its own machine learning techniques. It developed a suite of land information products and tools that could help inform producers about their land condition and pasture health. The Hub proved to be powerful and reliable, providing a frequent data stream and an impressive spatial resolution of 10 metres. The pre-processed Sentinel-2 data also allowed Cibo Labs to focus on product development for its clients, rather than costly data processing.
Impact: The development of these tools could help enhance the productivity of one of Australia’s most successful and important industry sectors. The Hub’s free and open access to Sentinel data also provides exciting business opportunities for small companies like Cibo Labs, allowing them to develop unique services that otherwise might not be possible.
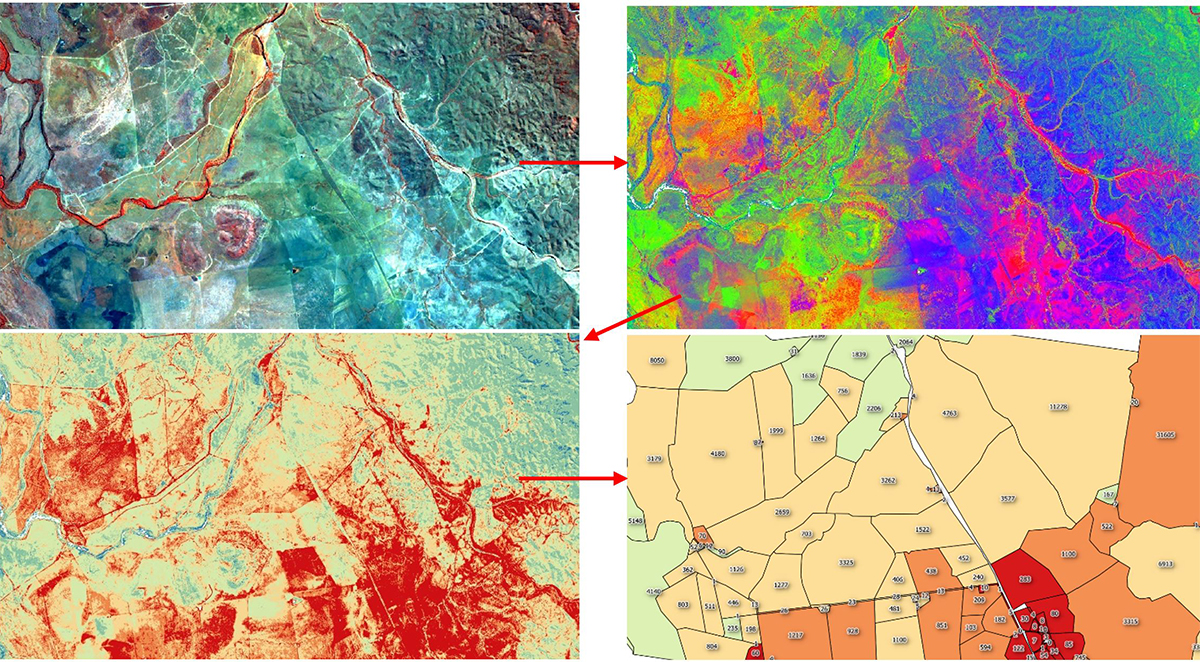
Figure: (Top left) Fully calibrated Sentinel-2 imagery. (Top right) Fractional cover. (Bottom left) Total standing dry matter in kg/ha. (Bottom right) Total standing dry matter per paddock.
Case study 2: State-wide land cover monitoring and mapping
Department of Environment and Science (DES), Queensland Government
Challenge: For over 25 years, the DES has been monitoring and mapping Queensland’s landscape using remote sensing data from satellites, airborne sensors, ground-based platforms and field data. Historically, the primary source of systematically acquired satellite imagery used by DES was the Landsat series. DES was looking to expand their data sources to improve their ongoing operational State government monitoring and mapping programs.
Solution: Sentinel imagery available from the Hub has provided an additional source of satellite imagery to complement existing data sets. Copernicus provides cost-effective and advanced earth observation technology with a long-term mission plan and open data strategies. The high resolution and increased frequency of Copernicus data allows scientific enhancements to operational programs, such as mapping fractional ground cover, woody and riparian vegetation, and seasonal crop monitoring. Accessing data from the Hub is highly reliable, with guaranteed large-scale and timely data access.
DES’s Remote Sensing Centre has a well-developed, mostly automated system for download, storage, processing and analysis of Sentinel satellite imagery. This includes surface reflectance, seasonal composites, water masks and water index products. Recent advances in high performance computing technology and the frequency of data accessibility has made it possible to consider timely fire scar mapping and vegetation regrowth monitoring, and other emerging and future applications.
Impact: The Copernicus-derived products inform a range of natural resource and environmental management policies and reporting initiatives in Queensland. This includes protection and management of the Great Barrier Reef, State of Environment reporting, biodiversity conservation and planning, land condition monitoring, grazing land management, drought management, regional analysis and decision making for environmental regulation and the vegetation management framework.
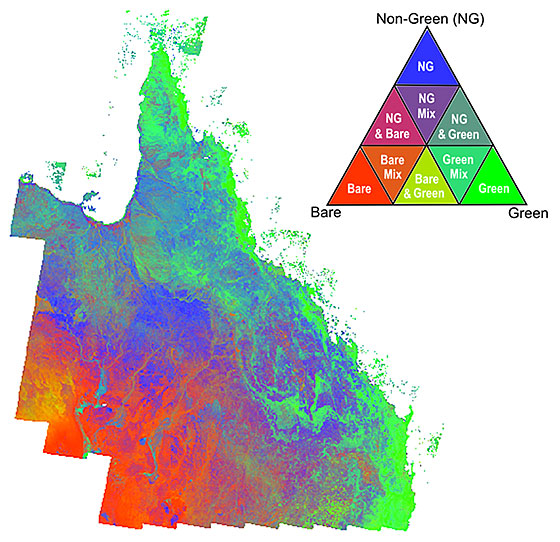
Figure: Seasonal fractional ground cover product for Queensland.
Source: Produced from ESA remote sensing data. Image processed by the Queensland Department of Environment and Science. For more information, see Queensland Government: Ground cover mapping methodology.
Case study 3: New South Wales fire extent and severity mapping
New South Wales Department of Planning and Environment (NSW DPE)
Challenge: Fire management agencies, as well as fire and landscape ecology researches, required a consistent approach to mapping fire extent and severity across the state.
Solution: In collaboration with the NSW Rural Fire Services, DPE scientists used surface reflectance and fractional cover images, derived from the Hub’s Sentinel-2 archives, to compare before and after fire events. This data was then used to train and test machine-learning algorithms, creating fire extent and severity maps. The high-frequency, streamlined provision of the Hub’s Sentinel-2 imagery facilitated the semi-automated approach, and was critical for building the maps at a state-wide scale.
Impact: The NSW Fire Extent and Severity Mapping system is now a routine statewide monitoring program. It has supported fire behaviour and fuel hazard assessment, rapid post-fire response operations and field assessments. FESM has also been widely used in fire and landscape ecology research.
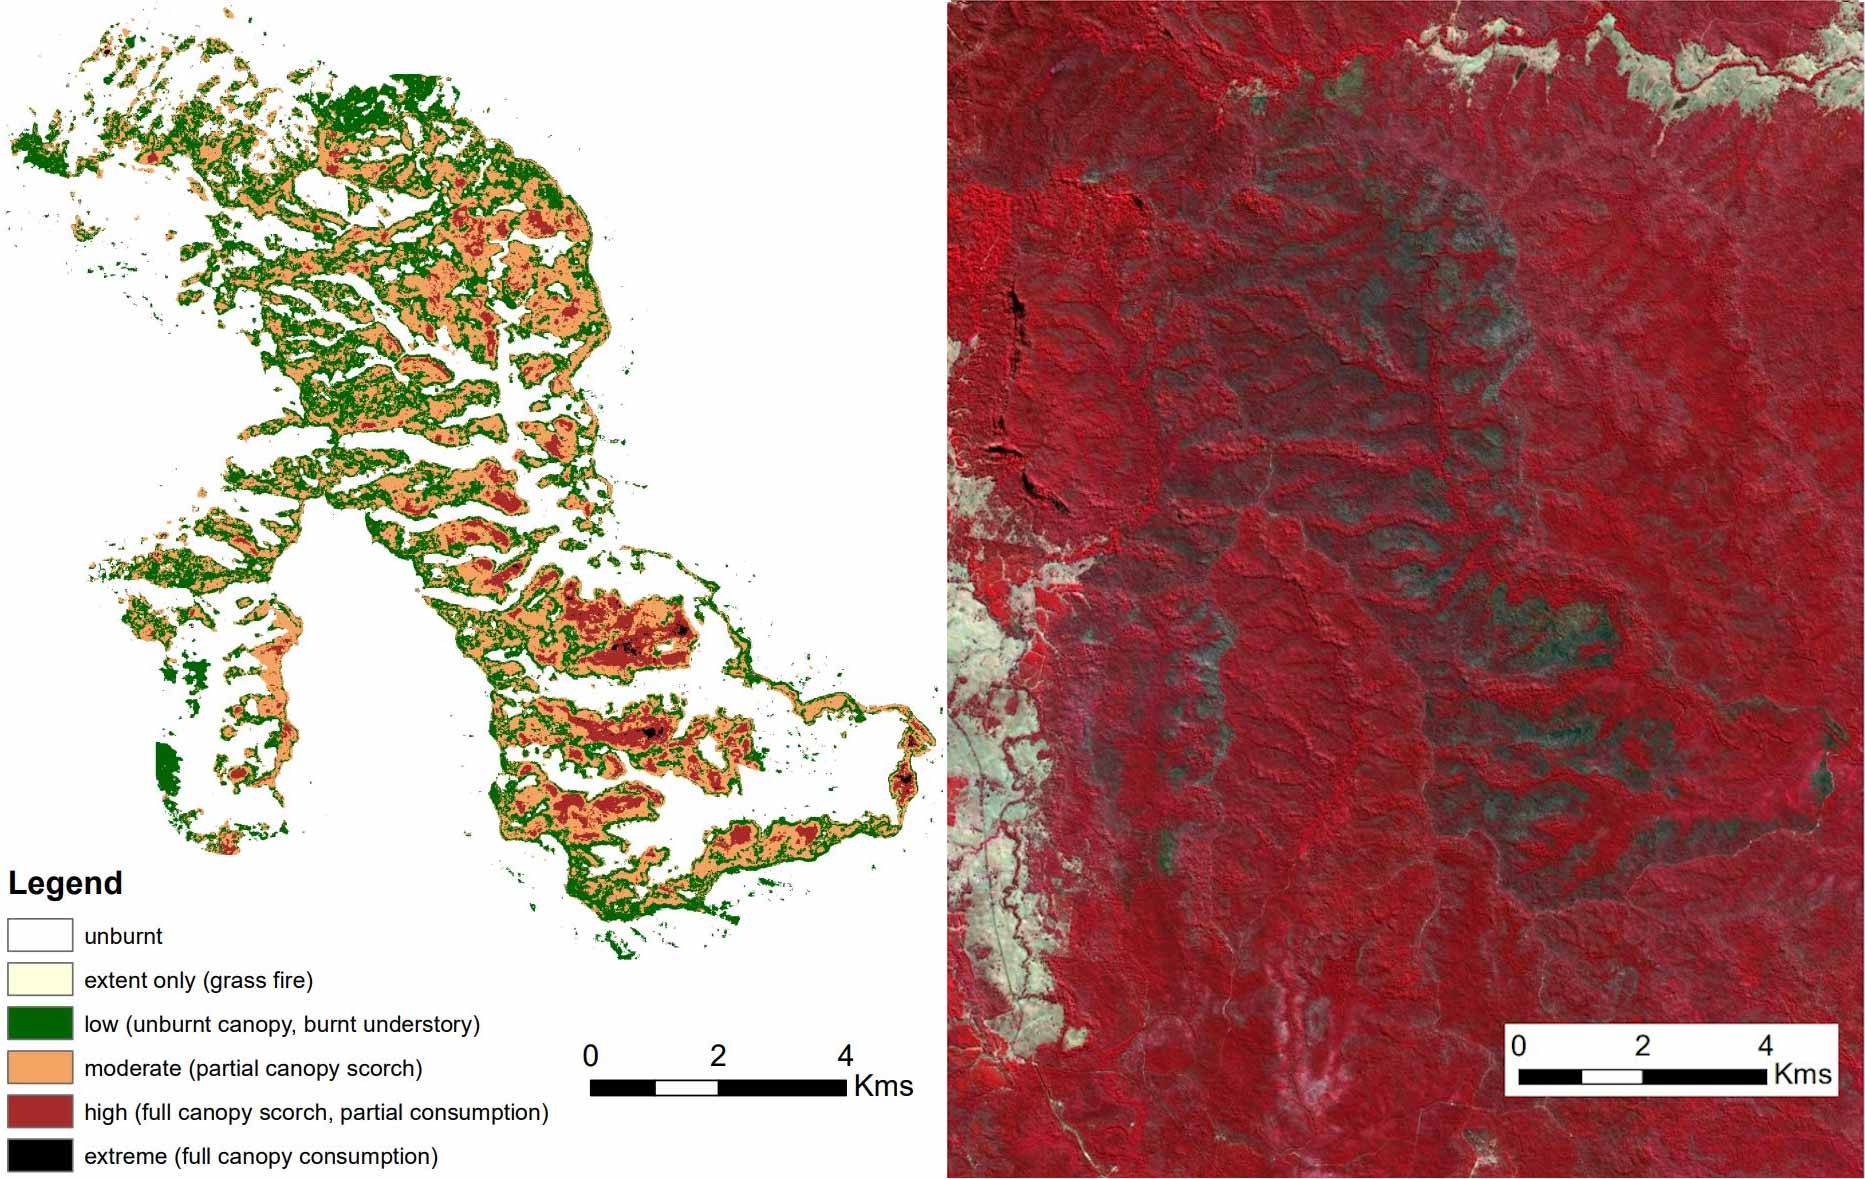
Figure: NSW FESM map (left) created from Sentinel-2 satellite imagery (right) of the Mt Marsh bushfire in Richmond Valley, northern NSW (Aug 2018).
Case study 4: Mapping surface deformations due to the Lake Muir earthquake
InSAR Team, Geoscience Australia
Challenge: Geoscience Australia monitors, analyses and reports on the occurrence of significant earthquakes within Australia and its territories. In September 2018, an earthquake of local magnitude 5.7 occurred in the Lake Muir region of WA. There was a large degree of location uncertainty with the seismic measurements, and it was difficult to locate where (or even if) any earthquake surface deformation had occurred. The InSAR Team was tasked with developing a more precise method of detecting surface deformations.
Solution: Two Sentinel-1 Synthetic Aperture RADAR (SAR) images of the earthquake’s epicentral region were taken from the Hub database: one before and one after the earthquake. Interferometric processing was used to map spatial patterns of ground surface movement over time between the two images. The results demonstrated that discrete surface deformation had, in fact, occurred as a result of the earthquake. Furthermore, the spatial extent of the surface deformation was mapped with a level of detail that would not have been possible using ground mapping.
Impact: This information allowed field teams to locate and target the 5 km-long linear discontinuity and identify it as a discrete surface rupture. It is anticipated that the use of Sentinel-1 interferograms will lead to the rapid post-earthquake deployment of damage and surface deformation mapping, aftershock monitoring and seismic hazard assessment. It could also be used to monitor other surface movement events, such as landslides, dam failures and groundwater extraction.
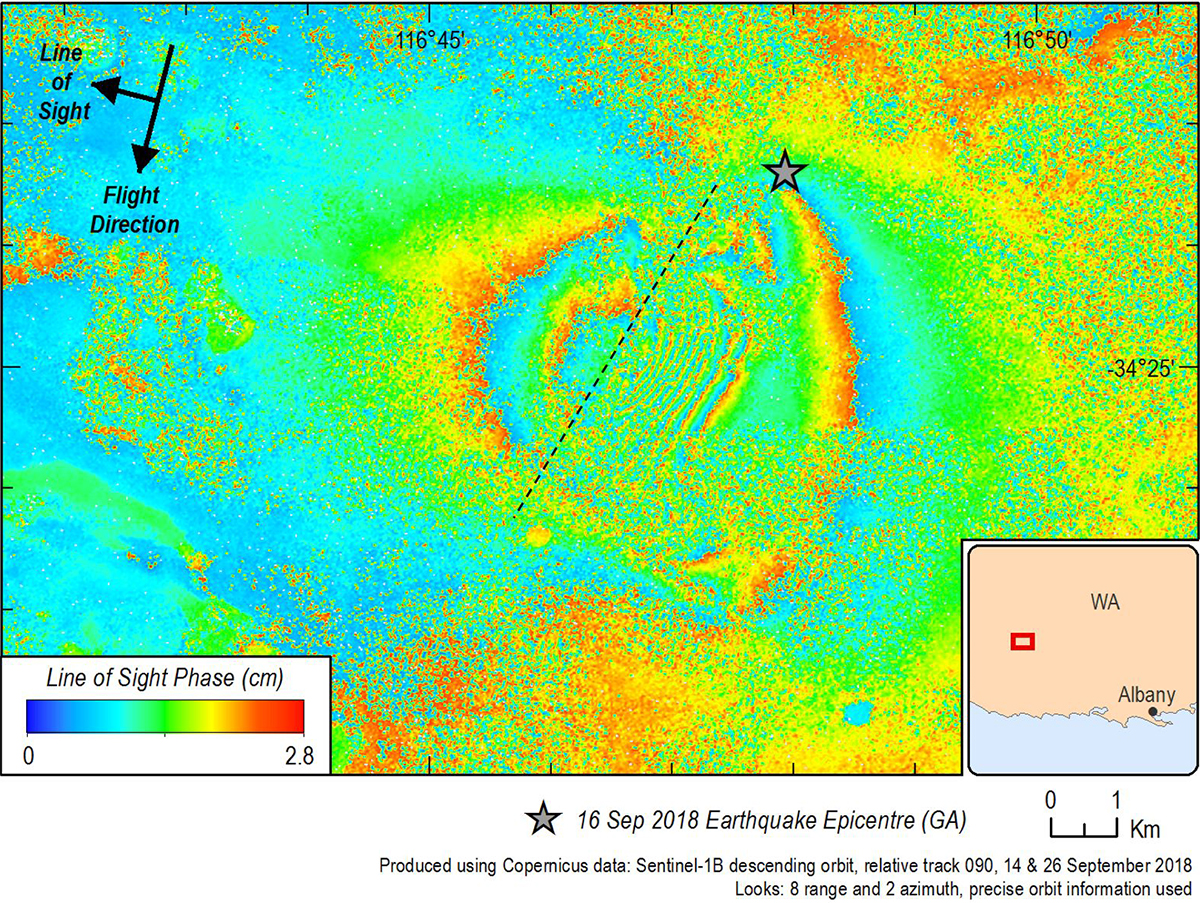
Figure: Sentinel-1 interferogram of the Lake Muir earthquake.
Case study 5: Measuring the colour of the Great Barrier Reef
Aquatic Remote Sensing Team, CSIRO Environment
Challenge: Atmospheric correction is a prerequisite to derive reliable water quality information from remotely sensed imagery. Atmospheric correction removes effects caused by air molecules (Rayleigh Scattering) and aerosols particles (Mie scattering) in the atmosphere. Above coastal waters this presents a challenge due to the complexity to separate the atmospheric and oceanic light signals from the total signal measured by the satellite.
Solution: To solve this problem, CSIRO Environment has developed algorithms based on inverse modelling of coupled ocean-atmosphere radiative transfer simulations using state-of-the-art machine learning methods. The algorithms are applied to the full mission archive of the Sentinel-3 Ocean and Land Colour Instrument (OLCI) data sourced from the Copernicus Australasia Regional Data Hub. The marine surface reflectance (colour) for the entire Great Barrier Reef Marine Park is estimated at specific spectral bands that can be visualized through the eReefs Data Explorer (see Figure).
Impact: The derived marine surface reflectance outputs are used as data assimilation inputs to the eReefs Biogeochemical Model and enable the computation of the marine water quality scores for the annual Great Barrier Reef Report Card, which measures progress towards the Reef 2050 Plan developed by the Australian and Queensland Governments.
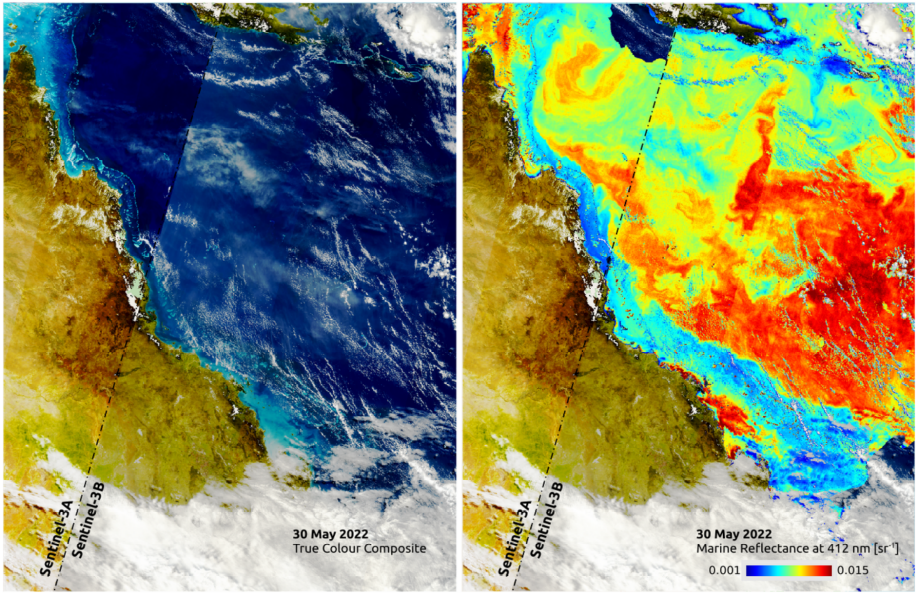
Figure: True colour composite acquired over the Great Barrier Reef by Sentinel-3 A/B OLCI on 30 May 2022 (left) and corresponding derived marine surface reflectance at a wavelength of 412 nm.
For more information see eReefs Research
Case Study 6: Monitoring the Great Barrier Reef for illegal oil discharges by passing vessels
Aquatic Remote Sensing Team, CSIRO Environment
Challenge: Detection of oil discharges in marine waters from space using Synthetic Aperture Radar (SAR) satellite sensors satellite sensors has undeniably reduced their occurrence both in Europe (EMSA) and in the US (NOAA). A satellite-based monitoring service for oil spills or illegal oil discharges was not available in Australia until December 2021.
Solution: CSIRO Environment has developed, and deployed, a semi-automated oil slick monitoring and detection system specifically tailored to the Great Barrier Reef using the Sentinel-1A SAR satellite sensor. Empirical and machine learning techniques specifically tuned for the Great Barrier Reef (such as the presence of reefs, which resemble oil slicks in SAR imagery) allow for daily monitoring of the marine park and accurate reporting of possible oil-like features. The system is operated daily under the eReefs Project by CSIRO Environment for the monitoring of the Great Barrier Reef. The Sentinel-1 SAR scenes are automatically downloaded from the Copernicus Australasia Regional Data Hub and processed using a uniquely designed workflow.
Impact: Satellite remote sensing is without doubt the most adequate technology suited for the large-scale monitoring of the Great Barrier Reef, which covers 348,000 km2 (roughly equivalent to the size of Italy or Japan). The processing and detection workflow is operated by CSIRO Environment for the monitoring of the Great Barrier Reef and is relocatable to other regions within Australia and elsewhere, such as Australia's Northwest Shelf or Southeast Asia, where oil discharged from fixed oil and gas platforms or ships occurs regularly. When detections of oil slick features occur, a trained operator verify the information and may inform the relevant Australian agencies of possible incidents (see Figure).
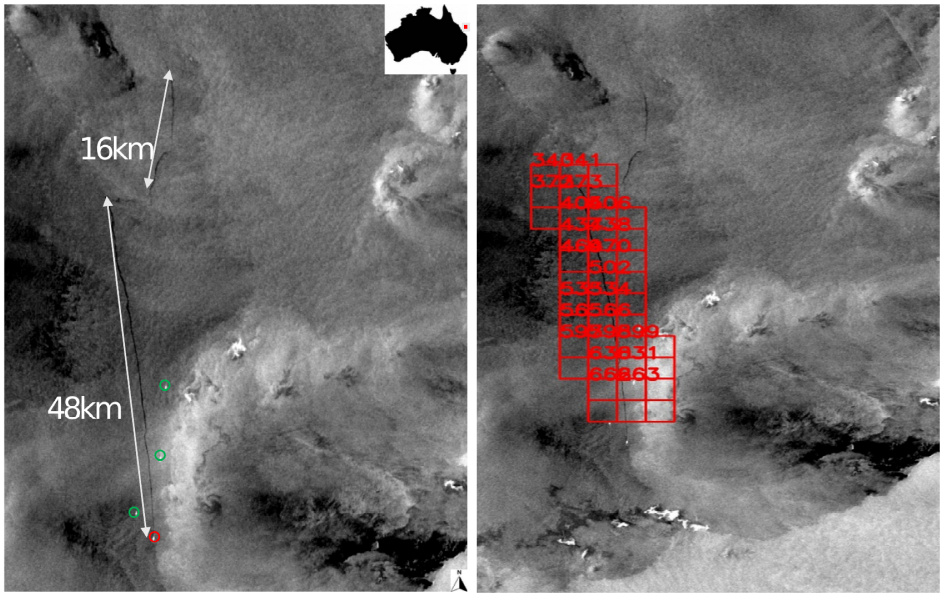
Figure: Left panel – the Sentinel-1A SAR scene acquired on 19th February 2023 showcasing a likely illegal discharge by a passing vessel (red circle) off Swain Reefs, Southern Great Barrier Reef, with other vessels nearby (green circles). Right panel – visualization of the automated detection (red squares) of the corresponding oil slick features by the CSIRO Environment Oil Spills detection system.
For more information see eReefs Research